Using Drones to Measure Plant-Soil Feedback Effects on Crop Productivity
Drones or Unmanned aerial system (UAS) have been used to provide data and analyses in the agricultural sector for some time now. UAS acquired high-resolution optical imagery and object-based image analysis (OBIA) techniques have the potential to provide spatial crop productivity information. Plant-soil feedback (PSF) describes the reciprocal interactions between plants and soil biota. Plants and their associated microorganisms influence soil properties, such as mineral nitrogen concentration and organic matter content, as well as the abundance of plant pathogens and mutualists. The net effect of these changes can enhance or suppress the performance of succeeding plants relative to fallow soil. Understanding PSF mechanisms is necessary to avoid the risk of negative PSF and generate potential positive PSF by applying well-matching crop rotations in agriculture systems.
In a new study, the influence of six winter cover crop (WCC) treatments (monocultures Raphanus sativus, Lolium perenne, Trifolium repens, Vicia sativa and two species mixtures) on the productivity of succeeding endive (Cichorium endivia) summer crop was investigated by estimating crop volume.
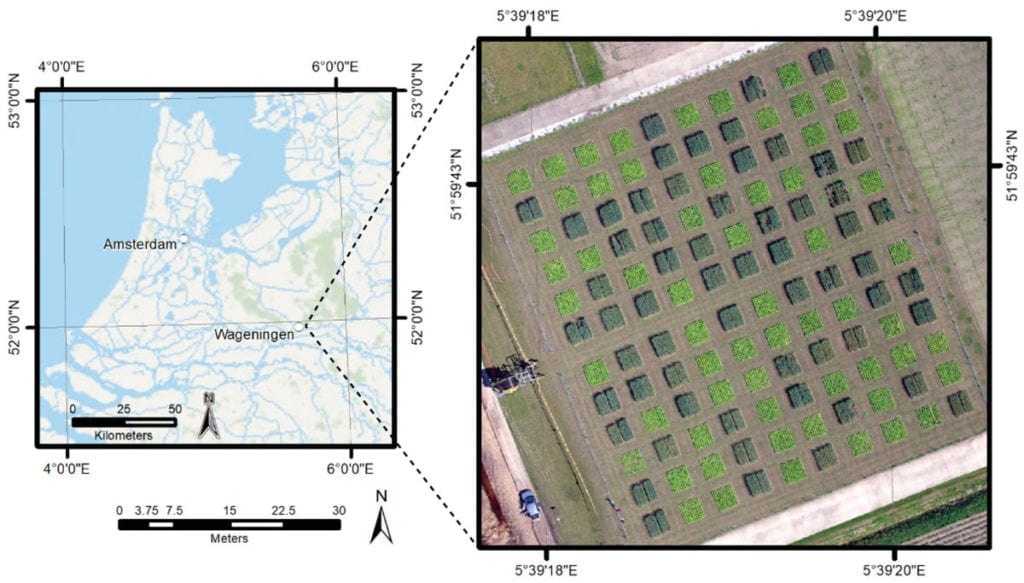
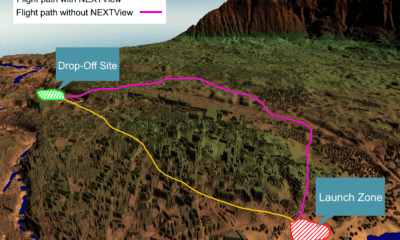
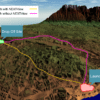
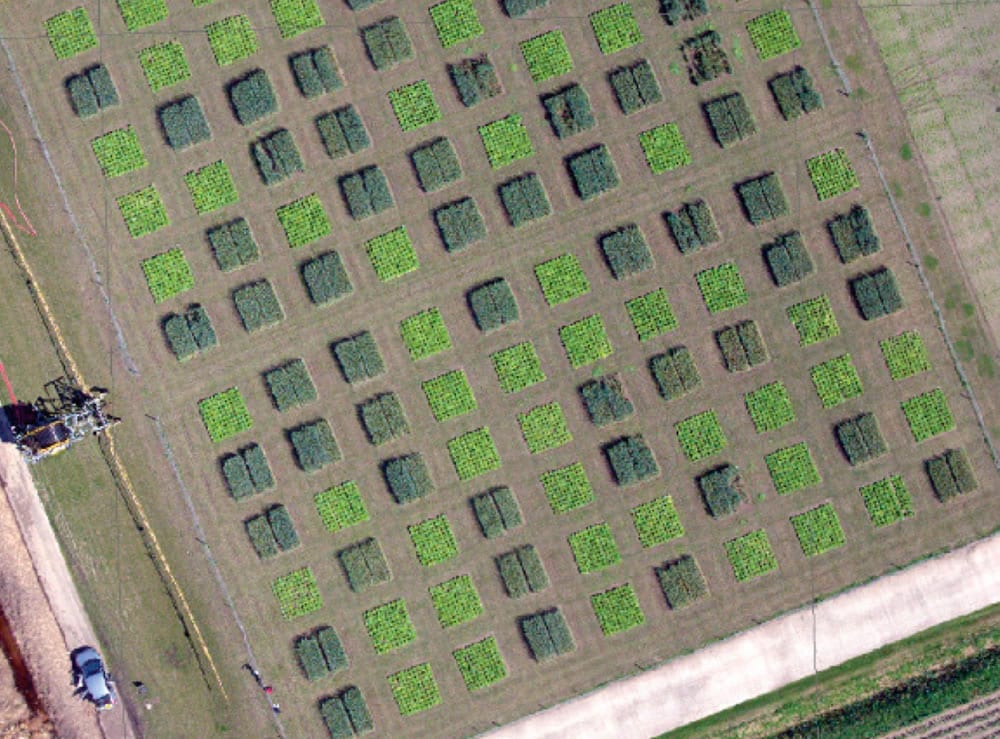
Study area near Wageningen; an orthophoto mosaic of 1 July 2015 displayed in a true colour composite. Both maps are projected in WGS 84/UTM zone 31N. In the image on the right the light green squares are plots with endive, the darker green squares are plots with oat.
The study area of approximately 0.3 hectare, property of Wageningen University & Research, is located in the eastern part of the Netherlands around 9 m above sea level (51◦59041.72” N, 5 ◦39017.89” E) and includes 60 experimental plots of 3 × 3 m2 with each plot planted with 10 × 10 endive individuals.
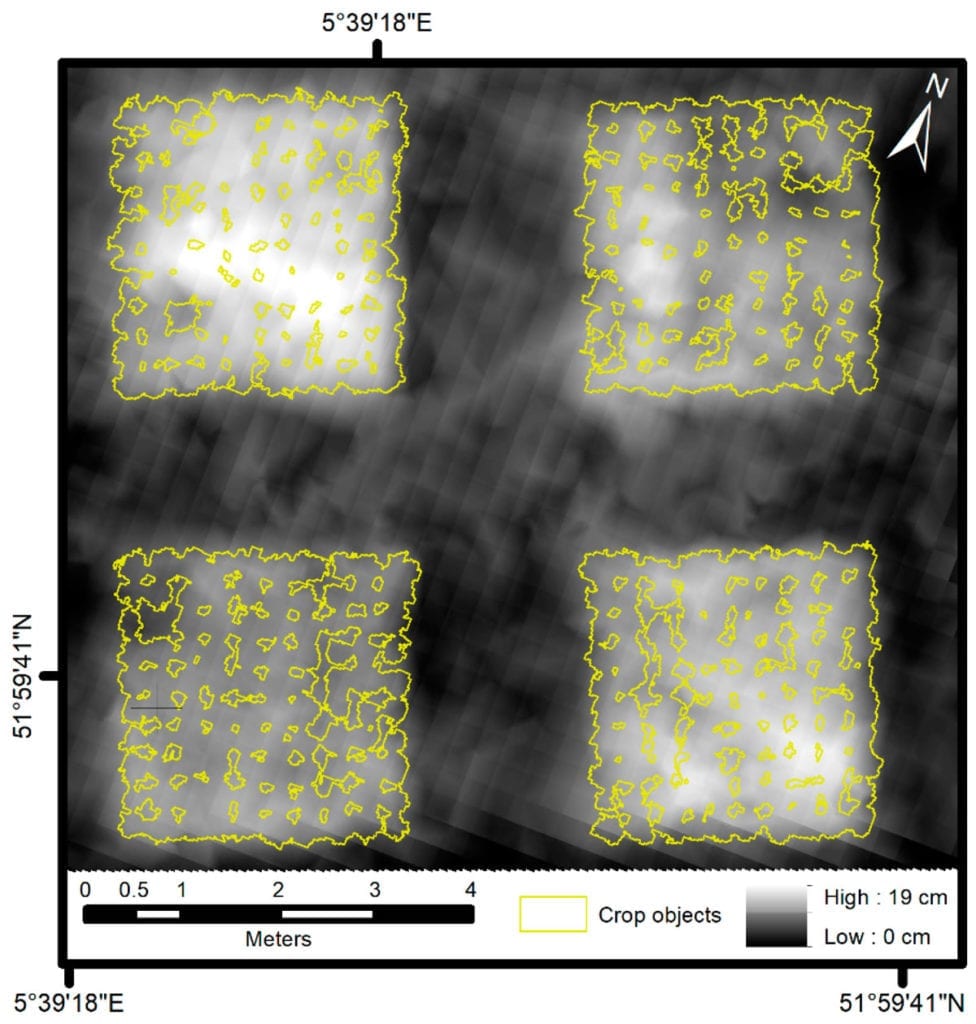
Map showing the crop height model (CHM) for four experimental plots including multi-resolution image segmentation (MIRS) based vector objects representing main crop area. Highest height values occur at the center of spatial objects while lowest height values occur at the edges of objects.
The processing approach developed in this study comprised five steps: photogrammetric pre-processing, template matching, object-based image analysis (OBIA), data fusion, and evaluation. First, UAS derived imagery was pre-processed using digital photogrammetry. Second, multi-resolution image segmentation (MIRS) and template matching were performed to segment main crop covered area and detect individual crops, respectively, on the orthophoto mosaic. Third, data fusion included: stratification of detected crops by main crop area, aggregation of CHM values on the OBIA-object level, followed by averaging objects’ area and volume by the amount of crops they represent. Finally, detection accuracies were determined and a comparison between crop volume estimates and field samples was undertaken.
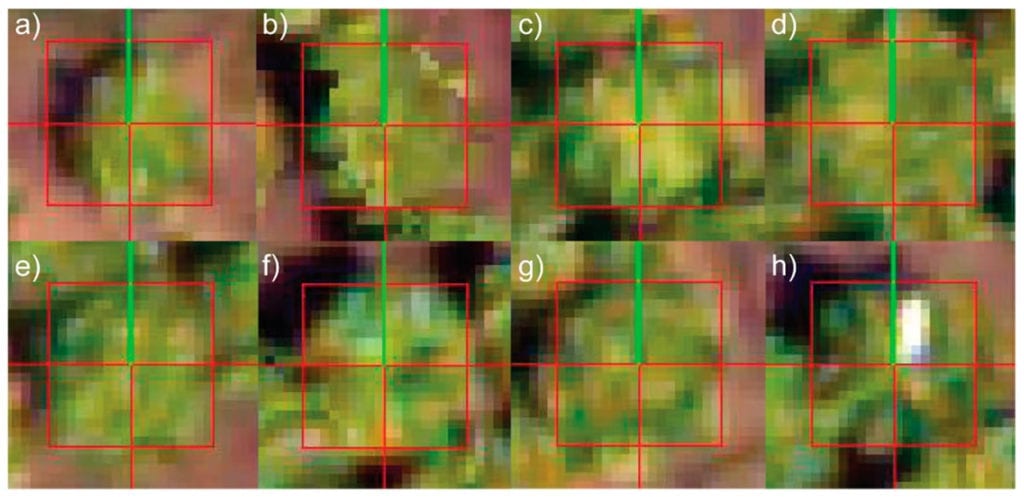
Eight sample templates used for template matching representing crop-objects with different shapes, sizes, and shadow directions: (a) small crop with no overlap, (b) two-sided overlap, (c) three-sided overlap, (d) four-sided overlap, (e) side with no shadow, (f) side with shadow, (g) crop located at plot’s corner, (h) possible error values within image.
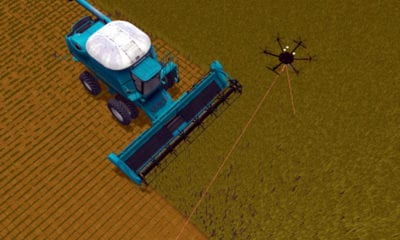
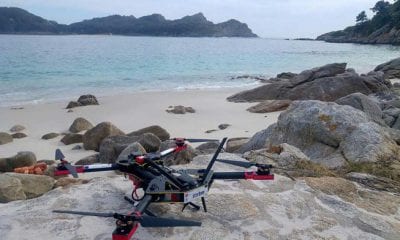
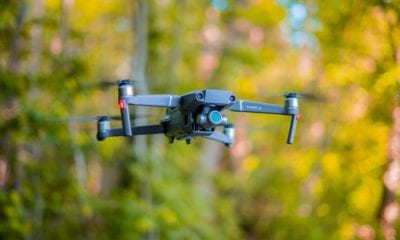
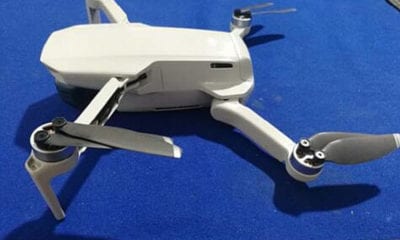
A drone flight was undertaken close to harvest at an average speed of 4 m s−1 and an altitude of 60 m. Aerial imagery was acquired at parallel flight lines, with images of 4608 × 3464 px having a forward and lateral overlap of 80% approximately, using the Panasonic GX1 camera with a 14 mm pancake lens. The camera was mounted onto an Aerialtronics Altura AT8 octocopter carrying an XSens MTi-G-700 GPSInertial Navigation System (INS) [38]. RTK-GPS equipment (Topcon FC-336) was used to register the field’s outer corners, identifiable on the aerial imagery, as ground control points.
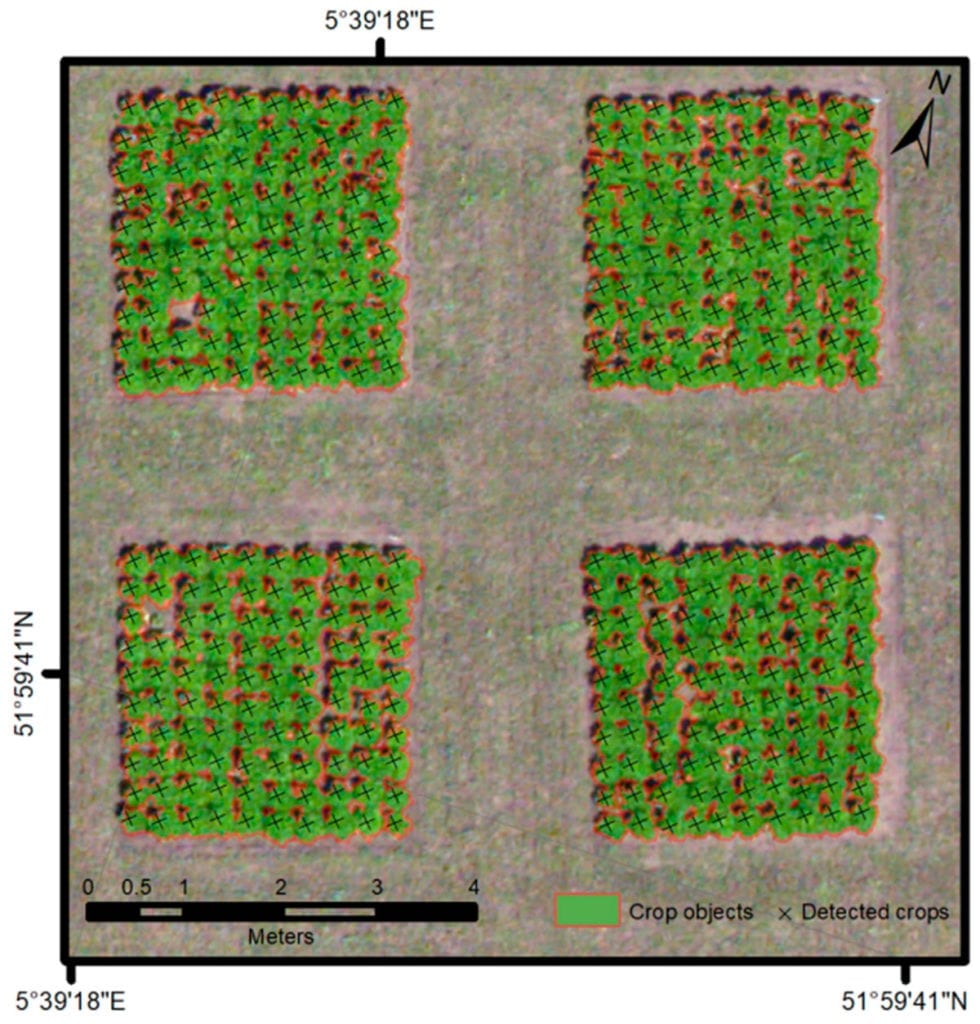
Map showing four experimental plots including multi-resolution image segmentation (MIRS) based vector objects representing main crop area (shown with 60% transparency) and detected Cichorium endivia crops resulting from stratified template matching.
From the set of experiment results, their observations and analyses, researchers deduced that UAS in combination with digital aerial photogrammetry and OBIA methods enable crop productivity analysis. Stratified template matching and MIRS resulted in a crop detection accuracy of 99.8% and well delineated main crop areas with 85.4% accuracy. Within an integrated workflow, mean C. endivia crop volume estimates had a strong positive correlation (R = 0.71) with in situ measured dry biomass, which was stronger than for mean crop area estimates (R = 0.61). The Lp WCC treatment resulted in a significantly different (lower) production of C. endivia compared to the other WCC treatments. Productivity differences resulting from the WCC treatments were larger for C. endivia crop volume in comparison to field measured biomass, with crop volume being an important parameter given the crop is primarily marketed fresh.
As far as scalability of the project is concerned scientists concluded that the developed workflow has potential for PSF studies as well as precision farming due to its flexibility and scalability. Our findings provide insight into the potential of UAS for determining crop productivity on a large scale.
The research team comprised scientists Rik J. G. Nuijten, Lammert Kooistra and Gerlinde B. De Deyn supported by the Faculty of Geosciences, Utrecht University, Laboratory of Geo-Information Science and Remote Sensing at the University and Research; Soil Biology Group, Environmental Sciences, Wageningen University and Research all from Wageningen, the Netherlands; and Faculty of Forestry, University of British Columbia, 2424 Main Mall, Vancouver, Canada. This work was supported by an NWO-ALW VIDI to GBDD (grant No. 864.11.003).
Citation: Using Unmanned Aerial Systems (UAS) and Object-Based Image Analysis (OBIA) for Measuring Plant-Soil Feedback Effects on Crop Productivity, Rik J. G. Nuijten, Lammert Kooistra and Gerlinde B. De Deyn, Drones 2019, 3(3), 54; https://doi.org/10.3390/drones3030054