Conservation
Using Drones to Monitor Salt Marsh Shorelines
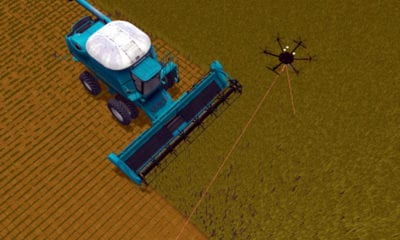
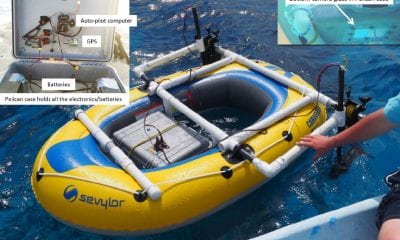
Drones are now a vital tool in assessing the health of salt marshes which are crucial for the ecosystem. Salt marshes provide a critical habitat for many species, decrease storm surge by attenuating waves, improve ecosystem health by cycling nutrients and they sequester carbon. The threat to a healthy existence of salt marshes comes from anthropogenic factors, sea level rise and sediment deficits and can also be influenced by plant–herbivore interactions.
Given the substantial ecosystem services provided by marshes, it is important to be able to measure their extent and seaward edge at high temporal and spatial resolutions. While for individual marsh complexes, un-vegetated and vegetated areas are identified in order to compute actual marsh coverage, use of remote sensing to track the seaward edge along salt marsh shorelines is less evolved.
The shoreline is now often defined as the mean high water (MHW) elevation and is often extracted from light detection and ranging (LIDAR) elevation data. MHW elevations can be found in or calculated with the VDatum tool. The elevation along these transects is found from LIDAR (or other elevation) data and then the location of the MHW elevation is found on each transect. This leads to a datum-based, objective, and reproducible shoreline. Consistent estimates of shoreline change can then be calculated along these transects.
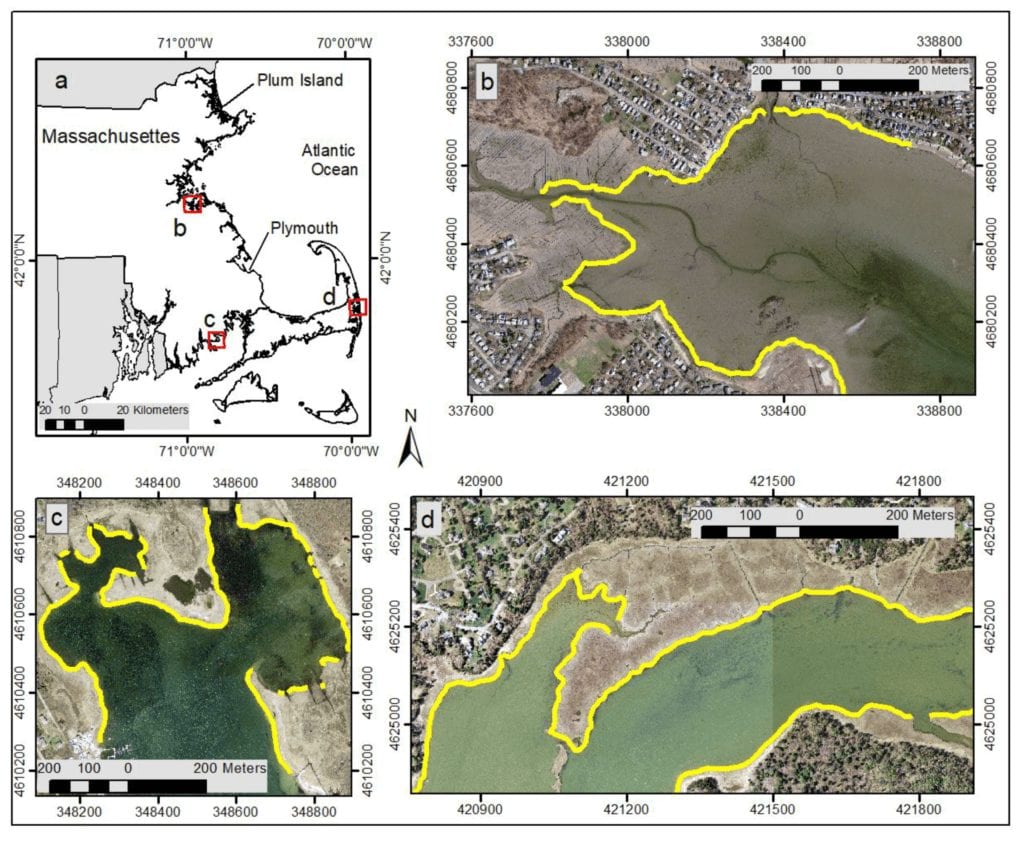
Figure 1. (a) Coastal Massachusetts, (b) Broad Meadows Marsh in Quincy, (c) Brant Island Cove in Buzzards Bay, (d) Pleasant Bay in Orleans. Yellow line in (b–d) shows marsh scarp from marsh edge from elevation data (MEED) using lidar data. Imagery from the U.S. Geological Survey (USGS).
Use of UAV in Study Methods:
A research team which was formed by researchers Amy S. Farris, Zafer Defne and Neil K. Ganju and supported by the U.S. Geological Survey, Woods Hole, USA, developed the marsh edge from elevation data (MEED) method to calculate the “marsh scarp” which is the abrupt elevation change at the edge of most salt marshes. The MEED method calculates slope from elevation data and defines the marsh scarp to be the maximum slope between mean high water and the mean tide level. The team used elevation data lidar; structure from motion (SfM) aerial photogrammetry collected by unmanned aircraft systems (UAS) or unmanned aerial vehicle (UAV) or drone as they are more commonly known.
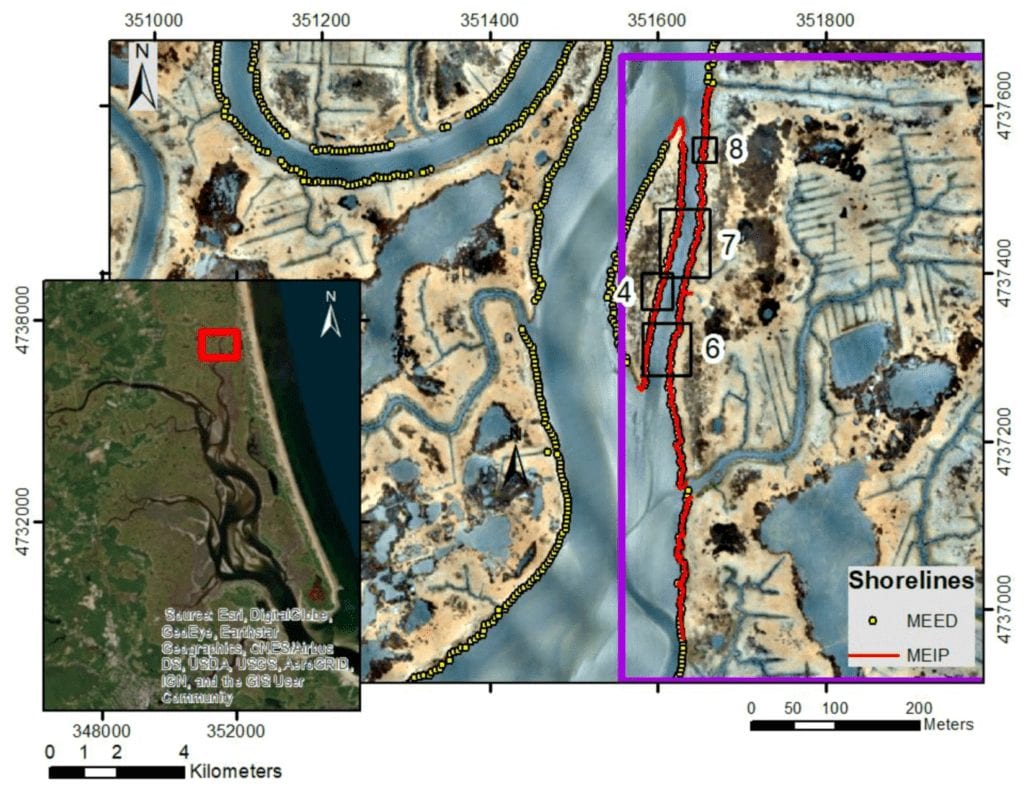
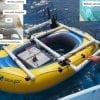
Plum Island Estuary, Massachusetts (MA). The shoreline calculated using the MEED method with unmanned aircraft system (UAS) data is shown with yellow dots. The unvegetated/vegetated line calculated using the marsh edge by image processing (MEIP) method with UAS data is shown as a red line. Box 4 indicates the area plotted in Figure 4. Box 6 indicates the area plotted in Figure 6. Box 7 indicates the area plotted in Figure 7. Box 8 indicates the area plotted in Figure 8. The purple line indicates the extent of the multispectral imagery used by the MEIP method. Imagery in main map is from UAS; imagery in the inset is from Esri.
The team also developed a second method shoreline called marsh edge by image processing (MEIP) to locate the salt marsh which uses image classification techniques to find the edge of the salt marsh vegetation. Remote sensing and aerial imagery have been used to inventory and classify coastal wetlands for many decades. Depending on the application and the data availability, multispectral or hyperspectral imagery, lidar, and radar systems can be used for mapping coastal marshes. For example, combining hyperspectral imagery with lidar-derived elevation has been shown to significantly improve the accuracy of mapping salt marsh vegetation.
In their paper the research team also presented the MEIP method, which combines multispectral imagery with elevation data and applies unsupervised pixel-based classification to define vegetated areas as an alternative approach for marsh edge detection. The MEIP method applies common classification techniques, utilizing higher resolution (1 meter) elevation and four-band imagery products that are consistent and available at a national scale. The same method can also be used to process even higher resolution data from smaller scale, rapid deployment systems such as UAS.
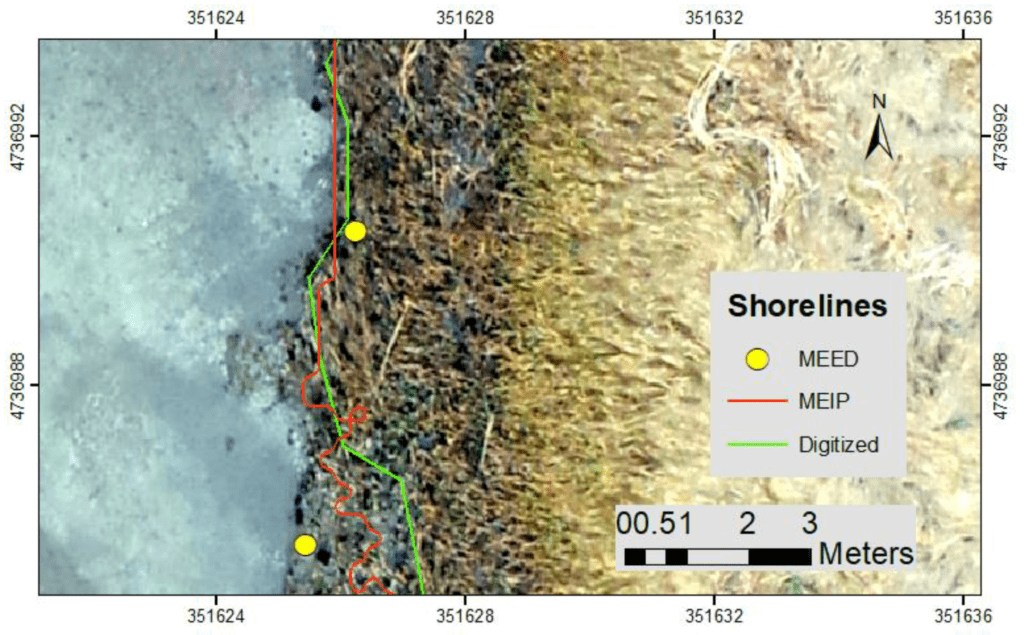
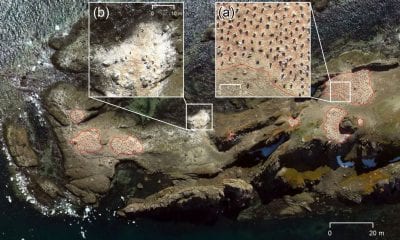
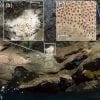
Plum Island Estuary, MA, UAS imagery. Yellow dots: Marsh scarp from MEED, red line: Unvegetated/vegetated line from MEIP, green line: Digitized edge of vegetation. The challenge in determining the location of shoreline with the heads-up digitization can be seen in the lower half of the image where the operator selected a somewhat subjective marsh shoreline, MEED method identified the maximum slope, and MEIP method identified a location somewhere between the two.
Researchers revealed the results of the MEED method using lidar data from Massachusetts and compared the results of both the MEED and MEIP methods using UAS data from the Plum Island Estuary in Massachusetts in their paper. The edge of the vegetation in the UAS data was heads-up digitized as compared to the MEED and MEIP results. The MEIP method is also used to calculate a shoreline for Plum Island Estuary using imagery from the National Agriculture Imagery Program (NAIP) and elevation data from the U.S. Geological Survey (USGS) Coastal National Elevation Database (CoNED). This paper concluded with a discussion about the advantages and disadvantages of each method.
Conclusions:
The MEED method was developed and tested using lidar data from the coastal salt marshes of Massachusetts (MA), USA. Both the MEED and MEIP methods were tested using data collected at the salt marsh network of the Plum Island Estuary, Massachusetts.
The research team quantitatively compared the marsh scarp using the MEED method with the unvegetated/vegetated line from the MEIP method using UAS data from the Plum Island Estuary in Massachusetts and concluded that both methods proved to be effective and efficient in identifying salt marsh shorelines within the study area, and they should be tested in other regions to assess how these methods could be applied in different geographic settings.
Citation: Identifying Salt Marsh Shorelines from Remotely Sensed Elevation Data and Imagery, Amy S. Farris, Zafer Defne and Neil K. Ganju, U.S. Geological Survey, Woods Hole, MA 02543, USA
Remote Sens. 2019, 11(15), 1795; https://doi.org/10.3390/rs11151795, https://www.mdpi.com/2072-4292/11/15/1795